F1 is often won and lost on tire strategy. Understanding how different compounds perform and when they reach their “cliff” is crucial.
Getting stint data
tif1 provides the Stint and Compound for every lap. We can use this to map out the entire race strategy.
import tif1
import pandas as pd

session = tif1.get_session(2025, "British Grand Prix", "Race")
laps = session.laps

# Group by driver and stint to see strategy
strategy = laps.groupby(["Driver", "Stint", "Compound"]).agg({
    "LapNumber": ["min", "max", "count"]
}).reset_index()

print(strategy.head())
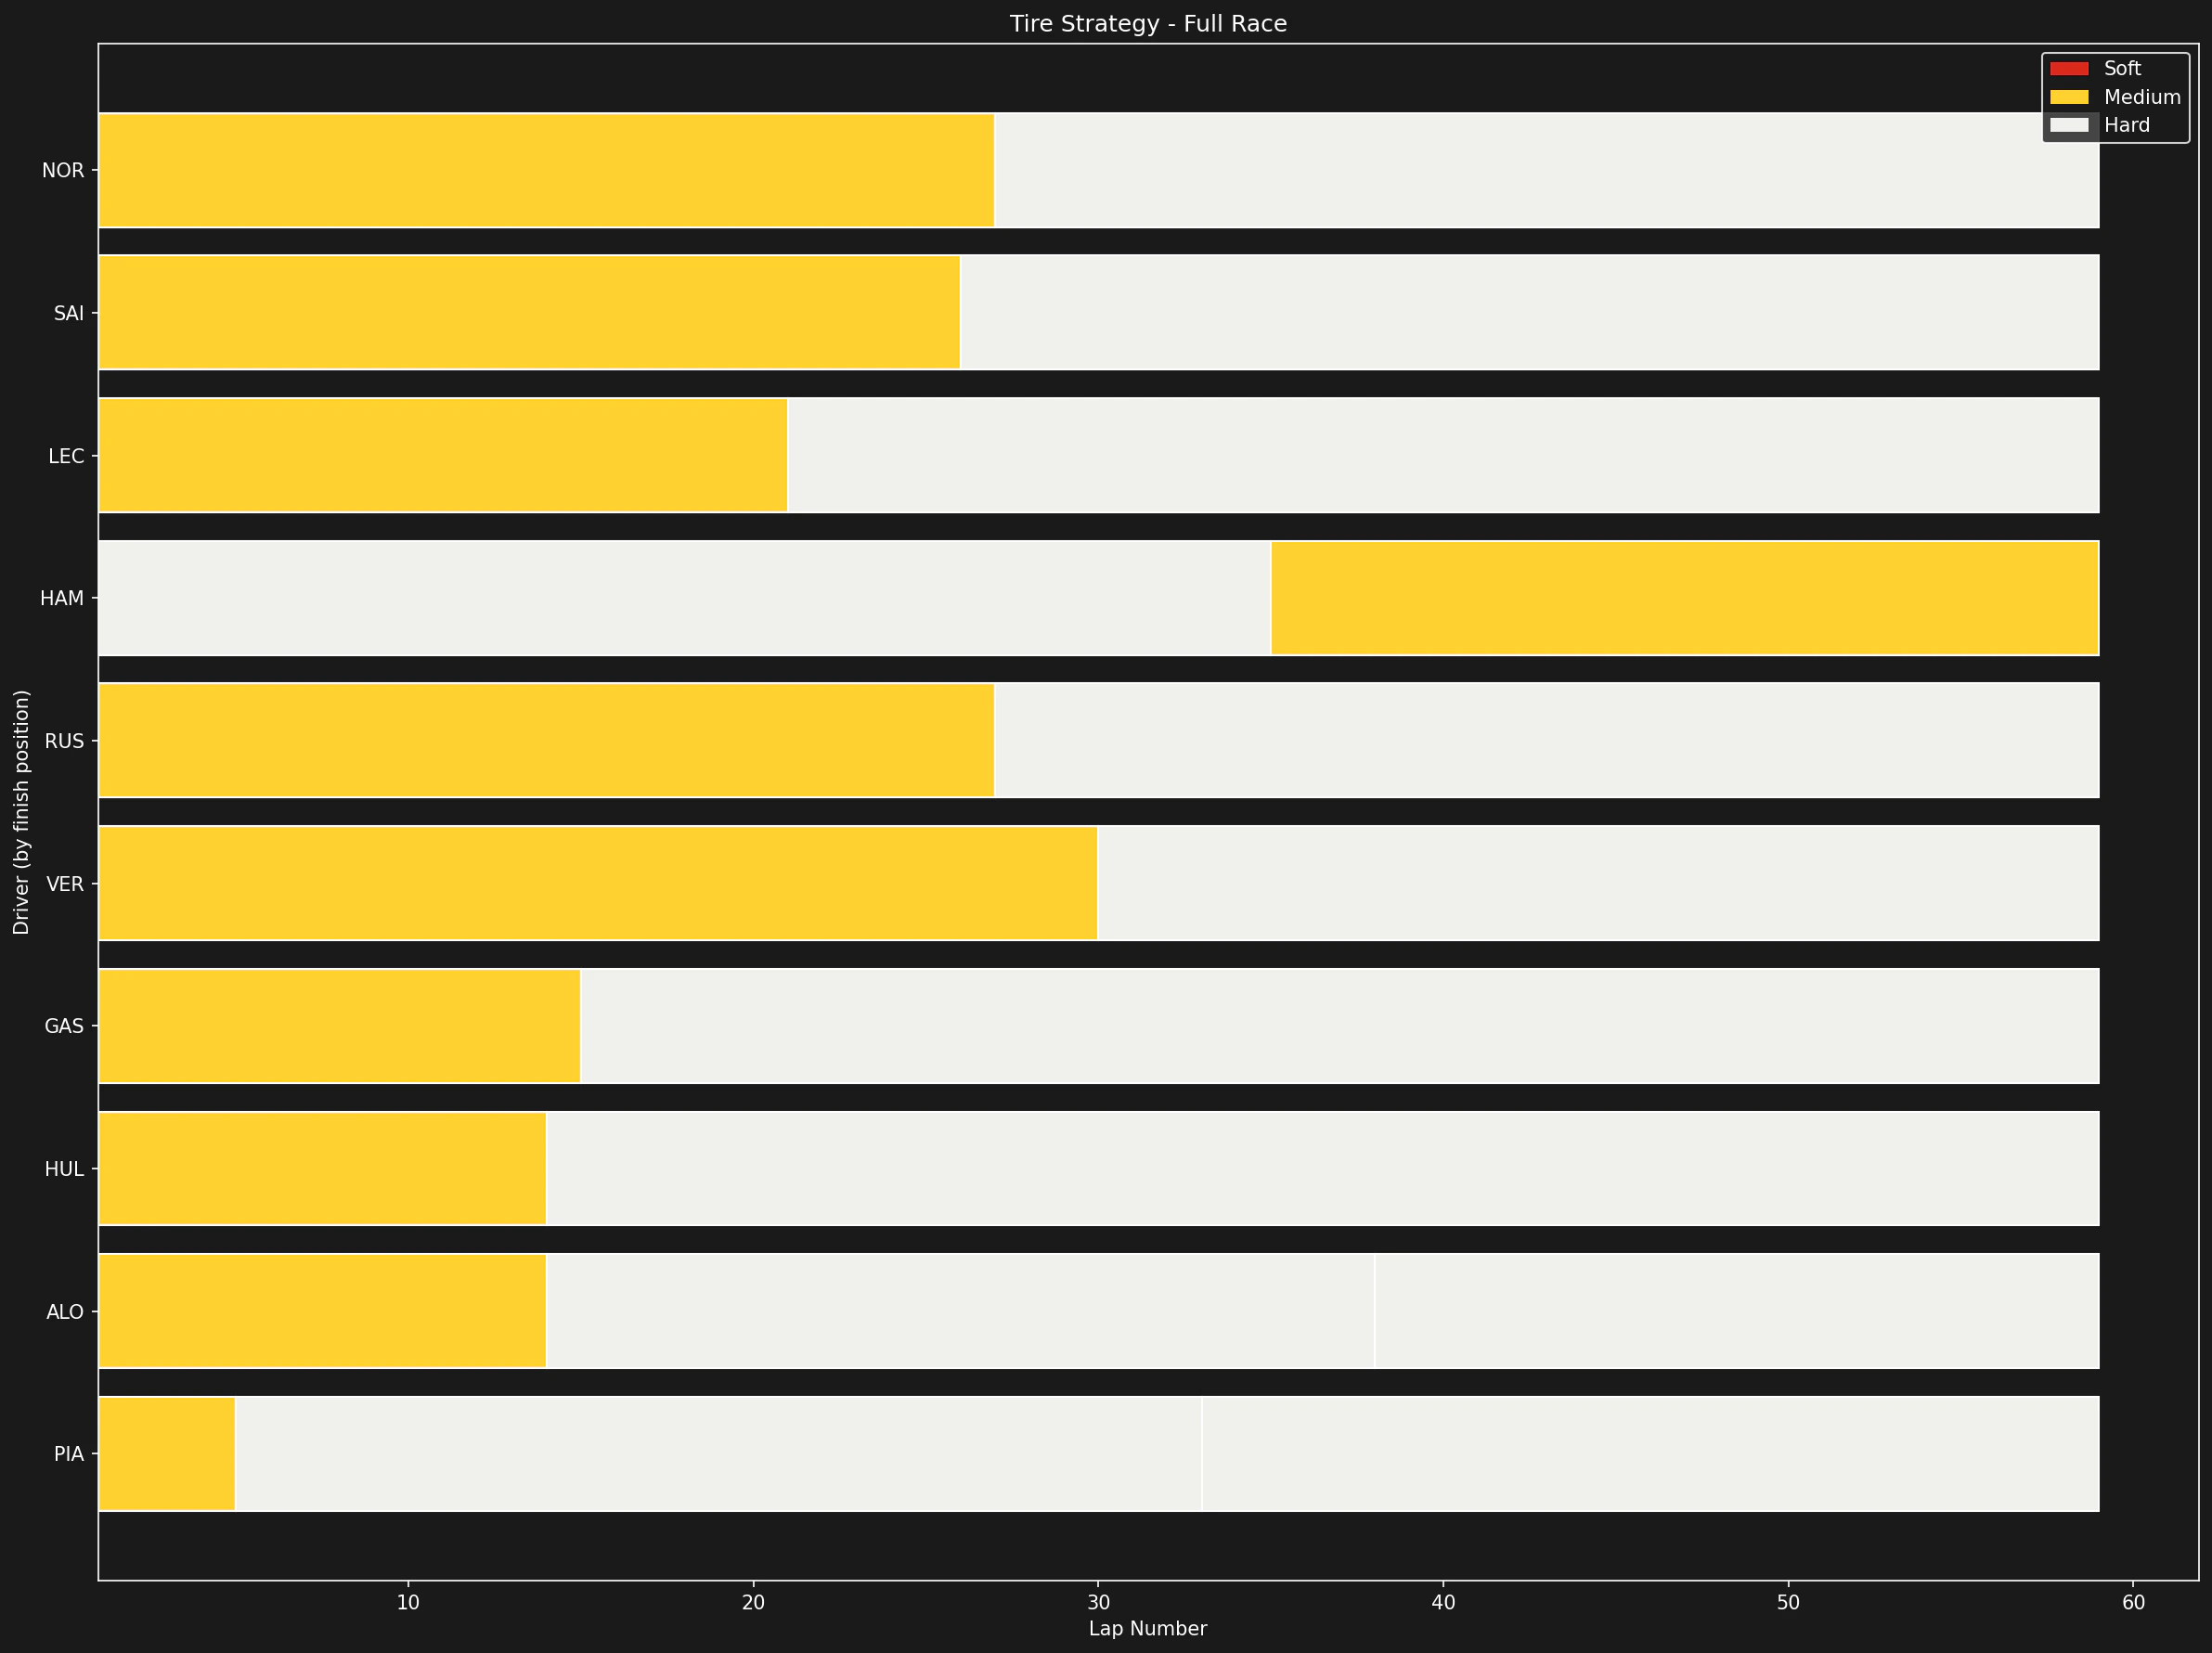
Visualizing the Strategy
A “Gantt-style” chart is the best way to visualize when drivers swapped tires.
import matplotlib.pyplot as plt

plt.figure(figsize=(12, 8))
drivers = session.drivers[:10] # Top 10 drivers

for i, driver_info in enumerate(drivers):
    driver = driver_info["driver"]
    driver_laps = laps[laps["Driver"] == driver]

    for stint in driver_laps["Stint"].unique():
        stint_laps = driver_laps[driver_laps["Stint"] == stint]
        compound = stint_laps["Compound"].iloc[0]

        # Color mapping
        color = {"SOFT": "red", "MEDIUM": "yellow", "HARD": "white"}.get(compound, "cyan")

        plt.barh(y=driver,
                 width=stint_laps["LapNumber"].max() - stint_laps["LapNumber"].min() + 1,
                 left=stint_laps["LapNumber"].min(),
                 color=color,
                 edgecolor="black")

plt.title("Race Strategy - Top 10 Drivers")
plt.xlabel("Lap Number")
plt.ylabel("Driver")
plt.gca().invert_yaxis()
plt.show()
Analyzing Degradation
Tire degradation is the increase in lap time as the tires wear out. We can calculate this by looking at the slope of lap times during a long stint.
# Filter for a long stint (e.g., VER Stint 2)
ver_stint_2 = laps[(laps["Driver"] == "VER") & (laps["Stint"] == 2)]

# Simple linear regression to find degradation rate
from scipy import stats
slope, intercept, r_value, p_value, std_err = stats.linregress(
    ver_stint_2["TyreLife"],
    ver_stint_2["LapTime"]
)

print(f"Degradation Rate: {slope:.4f} seconds per lap")
What the slope tells us
- Slope > 0: The driver is losing time as the tire wears (typical).
- Slope < 0: The driver is actually getting faster (often due to fuel burn-off overcoming tire wear).
- Near Zero: Excellent tire management.
Comparing Compounds
We can also compare the performance delta between Soft, Medium, and Hard tires.
# Average lap time per compound (cleaned)
clean_laps = laps[laps["LapTime"] < laps["LapTime"].min() * 1.1]
compound_performance = clean_laps.groupby("Compound")["LapTime"].mean()

print(compound_performance)
Summary
With tif1, you have access to detailed tire information that allows you to reconstruct race strategies and quantify the performance characteristics of every compound used in the race. Last modified on March 6, 2026